.jpeg)


QS World Future Skills Index 2027 - United States Briefing



21 July 2026


Download the full briefing for the complete analysis. Read a few key findings below.
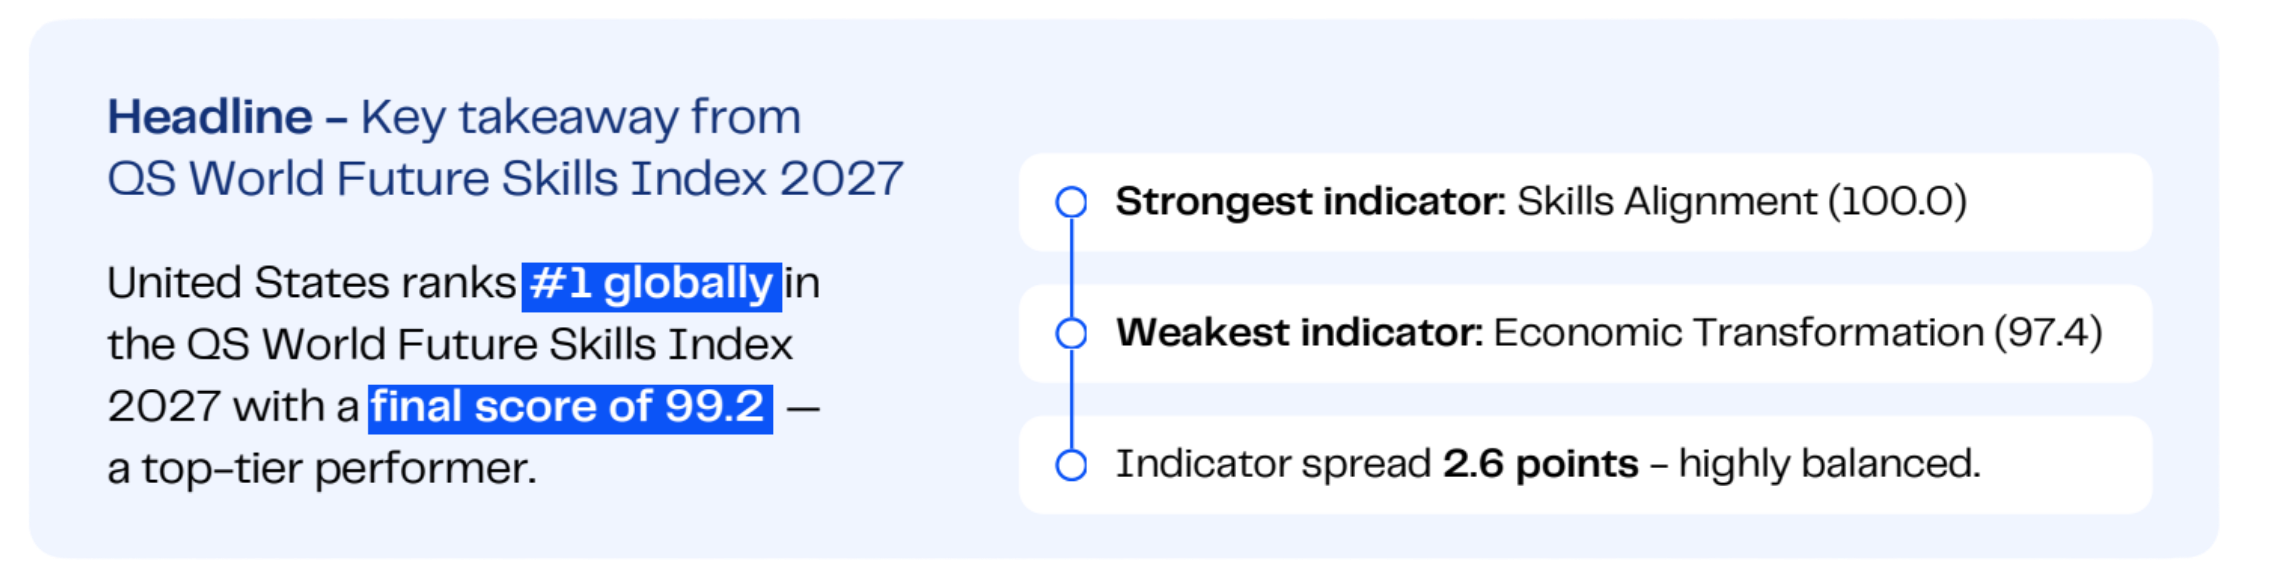
The United States profile shows a highly balanced performance across the four indicators (spread of 2.6 points). Its strongest contribution comes from Skills Alignment (100.0, rank #1), while Economic Transformation is the relative weak spot (97.4, rank #6).
The indicator profile suggests the economy has built strong human-capital and academic foundations, but underlying economic conditions may constrain its ability to fully translate those foundations into realised workforce transformation.
Peer positioning insight - comparison against regional and income-group cohorts
In its regional cohort (North America), United States ranks #1 of 2 eligible economies. Its Final Score of 99.2 compares to a regional median of 96.4 (+2.8 vs regional median).
In its income-group cohort (High-income countries), it ranks #1 of 47 eligible economies, with its Final Score +20.5 vs the income group median of 78.7.
The closest regional rival is Canada; the closest income-group rival is Australia.
closest 5 by Final Score within selected economy's region
closest 5 by Final Score within selected economy's income group
The QS World Future Skills Index evaluates how effectively economies can develop, align, and apply skills in a fast-changing global economy. Rather than focusing on higher education only or labour markets in isolation, the Index measures how well higher education systems align with workforce needs in the age of AI.
As economies around the world adapt to the transformative impact of AI, both labour markets and higher education institutions face growing pressure to evolve. Covering 89economies, the Index assesses readiness to harness the opportunities created by AI through a talent-supply and talent-demand analysis. It combines QS’s proprietary data on university performance, jobs and skills, and AI transformation with internationally recognised indicators to provide a global benchmark of AI readiness.
The US ranks first globally in the QS World Future Skills Index 2027 with a Final Score of 99.2. With a Skills Alignment score of 100/100, US employers report the highest levels of satisfaction globally with the skills graduates have. The US also benefits from a highly balanced performance across indicators (2.6 point range), meaning that both supply of graduates and demand from employers is aligned.
Despite their Skills Alignment score, an area of critical improvement identified is for higher education to develop Human Cognitive Skills and Human-Centered Leadership skills (-13.0 and –12.2 gap respectively, satisfaction relative to importance). One path forward this sets out is placing a greater emphasis on experiential learning models within traditional degree programmes.
A forewarning, longer-term, the US also faces a challenge in Academic Readiness; as the international reputation and research quality of universities across the world continues to improve – particularly in the Asia Pacific – the US’ position as the global leader in the QS World University Rankings (WUR) will see further decline. We have seen this already. In the last ten years, the median rank position for US institutions in the WUR has gone from 391 (2017) to 760 (2027). With tightening federal and state-level research budgets and constrained volume of international talent in US higher education this continue to reduce.